U.S. EPA seeks feedback on draft National Strategy to Prevent Plastic Pollution

Plastic debris on a beach with water in the background.
Debris at Magee Wildlife Area near Oak Harbor, OH. (Credit: NOAA)

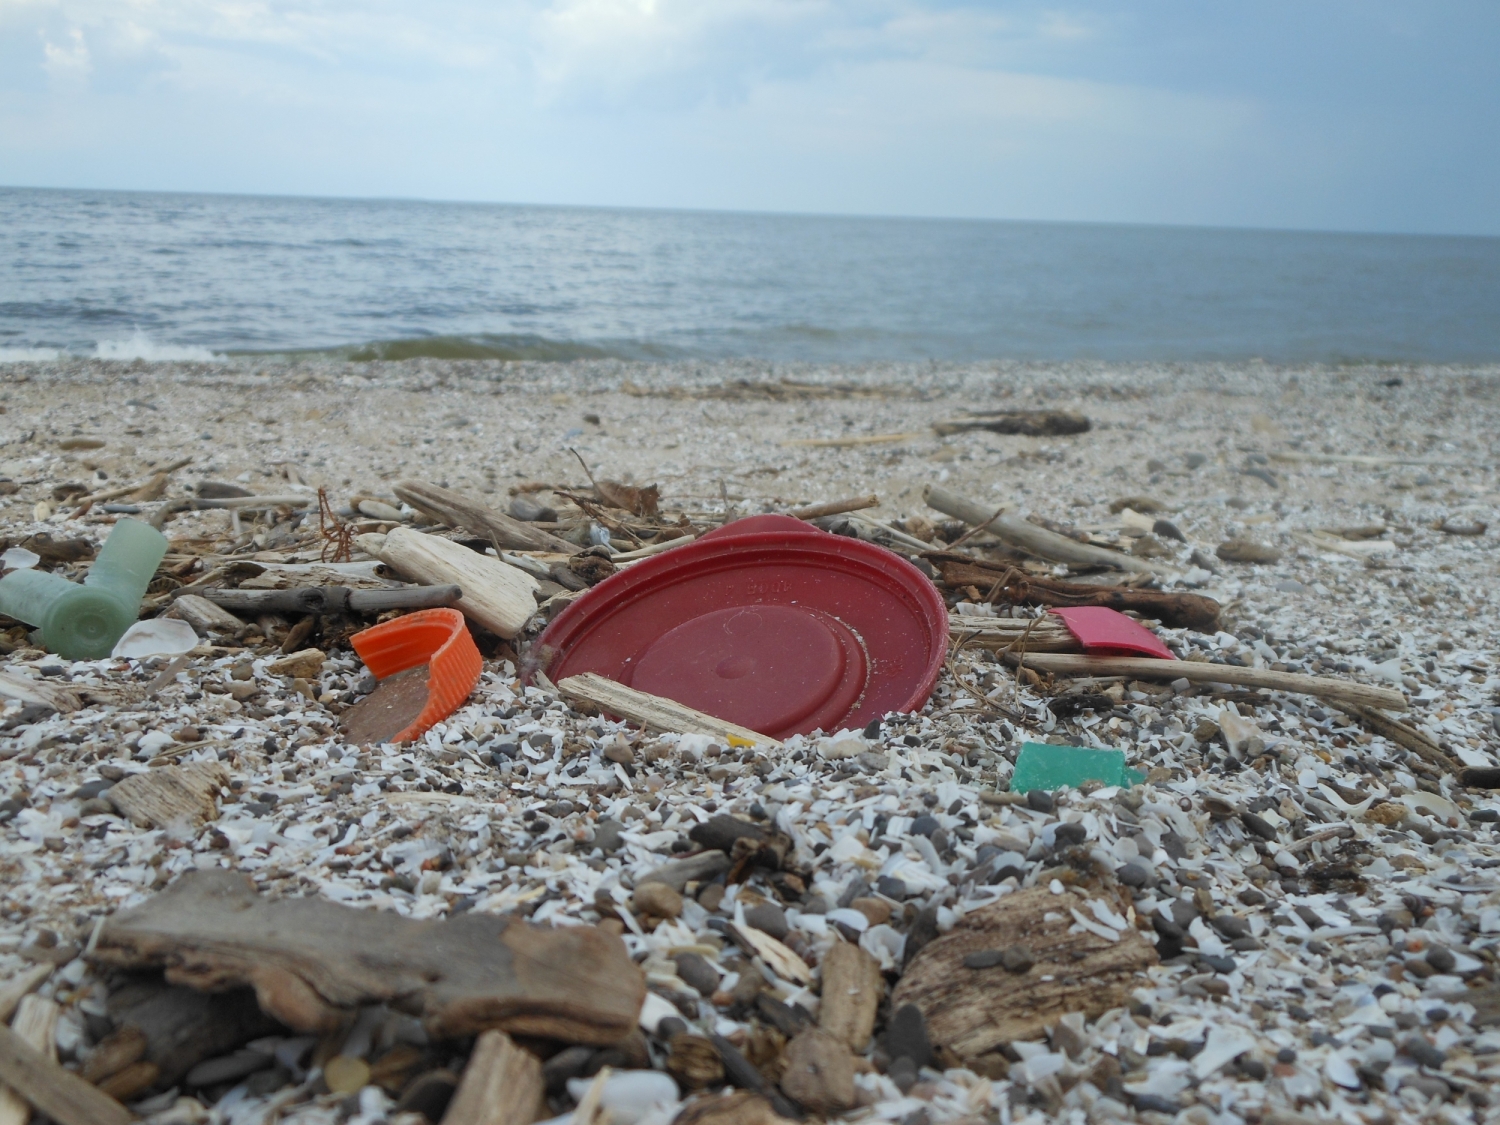
Although plastics have led to many positive innovations that have benefitted human society (e.g. less expensive medical devices, more portable electronic devices, increased fuel efficiency of vehicles made with plastic incorporated in their bodies, etc.), it is clear that plastic pollution is an ever-growing problem that threatens human and environmental health. When considering the fate of all plastic ever produced, Geyer et al. estimated that as of 2015, “approximately 6300 Mt of plastic waste had been generated, around 9% of which had been recycled, 12% was incinerated, and 79% was accumulated in landfills or the natural environment. If current production and waste management trends continue, roughly 12,000 Mt of plastic waste will be in landfills or in the natural environment by 2050.” [Note: Mt=million metric tons] In its 2022 report, Global Plastics Outlook: Economic Drivers, Environmental Impacts and Policy Options, the Organisation for Economic Co-operation and Development (OECD) stated that “Widespread plastics use and inadequate prevention measures have led to persistent plastic leakage. In 2019 an estimated 22 Mt of plastics leaked into the environment. The largest leakage source (82%) is mismanaged waste, i.e. waste that is inadequately disposed of. Other sources are abrasion and losses of microplastics (12%), littering (5%) and marine activities (1%).” They define “mismanaged waste” as “Waste that is not captured by any state-of-the-art waste collection or treatment facilities. It includes waste that is burned in open pits, dumped into seas or open waters, or disposed of in unsanitary landfills and dumpsites.” Even when plastics are collected and processed at a recycling facility, there is still potential for pollution. A study published this month in the Journal of Hazardous Materials Advances describes the analysis of wastewater from a UK plastics recycling facility before and after filters were installed. While filters decreased the discharge of microplastics, even with the filters in place, the total discharge from the multiple washes used in processing could produce up to 75 billion particles per cubic meter of wastewater. If these findings are extrapolated across the whole of the plastics recycling industry, the potential pollution from plastic recycling facilities alone is mind-boggling.

Plastics in the environment break down into smaller and smaller pieces over time. The full extent of the impacts of micro- and nano-plastics on Earth’s ecosystems is unknown, but we do know that wildlife may ingest plastic accidentally when eating food waste contained in plastic, because of visual similarities of plastics to their food sources, and in some cases because the plastic smells like food. When prey animals consume plastic, their predators ingest the plastic along with the prey. Even humans can ingest plastic in this way, and microplastics can also be inhaled. Microplastics are found worldwide, even in protected areas. They have been found in sea ice in the Arctic and on the ocean floor. They’ve even been found in human breast milk.

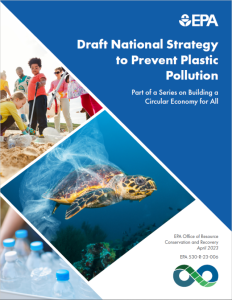
Given the scale and ubiquity of plastic pollution, in April 2023 the U.S. Environmental Protection Agency (EPA) released a Draft National Strategy to Prevent Plastic Pollution This builds upon EPA’s National Recycling Strategy, focusing on means to reduce, reuse, collect, and capture plastic waste.

image of national strategy cover pageEPA has identified three key objectives for the strategy. The draft strategy document lists proposed actions associated with each objective.

  • Objective A: Reduce pollution during plastic production. This entails designing products for reuse and recycling, using less impactful materials, phasing out unnecessary products, and ensuring proper controls at plastic production facilities.
  • Objective B: Improve post-use materials management. This involves the pursuit of circularity through pathways susch as reuse, refilling, and composting.
  • Objective C: Prevent trash and micro/nanoplastics from entering waterways and remove escaped trash from the environment. The pursuit of this objective may involve policy, programs, technical assistance, compliance assurance efforts, improved water management, improved measurement, increased public awareness, and further research.

Read the full draft strategy at https://www.epa.gov/system/files/documents/2023-04/Draft_National_Strategy_to_Prevent_Plastic_Pollution.pdf. An executive summary is also available.

EPA has opened a public comment period on this draft national strategy. Comments are due on or before June 16, 2023. EPA is asking the public to consider several key questions when reviewing and commenting on the draft strategy. To see these questions and learn more about how to submit your comments, see https://www.epa.gov/circulareconomy/draft-national-strategy-prevent-plastic-pollution#feedback.

Celebrate Pollution Prevention Week, Sept. 19-25, 2022

The 2022 P2 Week Poster, designed by Rowan Lambert, a senior mural artist at the University of New Orleans.

The third week of September every year is celebrated as Pollution Prevention (P2) Week in the U.S. Thus in 2022, we focus particularly on pollution prevention from September 19th to the 25th, although P2 can and should be a priority year-round.

As defined by the National Pollution Prevention Roundtable (NPPR, emphasis added), “Pollution is the contamination of air, soil, or water by the discharge of harmful substances. Pollution prevention is the reduction or elimination of pollution at the source (source reduction) instead of at the end-of-the-pipe or stack. Pollution prevention occurs when raw materials, water, energy and other resources are utilized more efficiently, when less harmful substances are substituted for hazardous ones, and when toxic substances are eliminated from the production process. By reducing the use and production of hazardous substances, and by operating more efficiently we protect human health, strengthen our economic well-being, and preserve the environment.”

Rather than being a burden on industry, NPPR points out that “Adopting pollution prevention practices and techniques often benefits industry by lowering a company’s operational and environmental compliance costs. By preventing the generation of waste, P2 can also reduce or eliminate long-term liabilities and clean-up costs. Furthermore, disposal costs are reduced when the volume of waste is decreased. This can also lead to a reduction in workplace exposures to hazardous materials which can affect workers’ health and hence, their productivity. If less waste is produced, there will also be a diminished need for on-site storage space. Furthermore, by preventing pollution there will be a greater likelihood that a company will be in compliance with local, state, and federal compliance statutes. Finally, as community pillars, businesses shoulder an important responsibility for protecting the environment and natural resources for their own good as well as that of society.”

And did you know that in 1990, Congress passed the Pollution Prevention Act (P2Act), which states “The Environmental Protection Agency must establish a source reduction program which collects and disseminates information, provides financial assistance to States, and implements the other activities….”

Helping businesses, organizations, institutions, and government agencies throughout Illinois and beyond to prevent pollution and use resources more efficiently to benefit our shared environment while also ensuring that companies and communities are more competitive and resilient is essentially the mission of the ISTC Technical Assistance Program (TAP). Our team is here to help your organization identify and implement ways to make your operations more sustainable and to prevent pollution. TAP is funded not only by the State of Illinois but also a variety of grants and fee-for-service projects for a variety of clients.

Currently, TAP has funding from the U.S. Environmental Protection Agency (EPA) to provide free sustainability assessments to Illinois manufacturers in the following sectors:

These assessments can help facilities reduce business costs, energy and water consumption, wastewater generation, emissions, and hazardous material usage, which can result in increased profitability, productivity, and competitiveness as well as recycling or diversion of by-products.

So if you are an Illinois manufacturer with facilities or supporting industries in those sectors, click on the link associated with your sector above to learn more about the assessment opportunity, and how TAP can help you identify P2 opportunities today. You can also access an overview flyer at https://uofi.box.com/s/fu0hsmj6skm52vl290nu7kiuohp758xa or contact Irene Zlevor via email or by phone at 217-300-8617. Additionally, a recorded webinar, presented to Sustain Rockford, describes the assessment process in detail.

There are opportunities for everyone to learn more about and practice P2–not just manufacturers. To learn more, explore the links below.

US EPA releases report on environmental impacts of US food waste

EPA infographic on environmental impacts of US food waste
Image from US EPA Office of Research and Development.

On November 30, 2021, the US Environmental Protection Agency (EPA) released a new report entitled “From Farm to Kitchen: The Environmental Impacts of U.S. Food Waste (Part 1).”

This report reveals the climate and environmental impacts of producing, processing, distributing, and retailing food that is ultimately wasted and projects the environmental benefits of meeting the US goal to prevent 50 percent of food waste by 2030. The report was prepared to inform domestic policymakers, researchers, and the public, and focuses primarily on five inputs to the US cradle-to-consumer food supply chain — agricultural land use, water use, application of pesticides and fertilizers, and energy use — plus one environmental impact — greenhouse gas emissions.

This report provides estimates of the environmental footprint of current levels of food loss and waste to assist stakeholders in clearly communicating the significance; decision-making among competing environmental priorities; and designing tailored reduction strategies that maximize environmental benefits. The report also identifies key knowledge gaps where new research could improve our understanding of US food loss and waste and help shape successful strategies to reduce its environmental impact.

The new report reveals that each year, the resources attributed to US food loss and waste are equivalent to:

  • 140 million acres agricultural land – an area the size of California and New York combined;
  • 5.9 trillion gallons blue water – equal to the annual water use of 50 million American homes;
  • 778 million pounds pesticides;
  • 14 billion pounds fertilizer – enough to grow all the plant-based foods produced each year in the United States for domestic consumption;
  • 664 billion kWh energy – enough to power more than 50 million US homes for a year; and
  • 170 million MTCO2e greenhouse gas emissions (excluding landfill emissions) – equal to the annual CO2 emissions of 42 coal-fired power plants

In short, significant resources go into growing, processing, packaging, storing, and distributing food. Thus, the most important action we can take to reduce the environmental impacts of uneaten food is to prevent that food from becoming waste in the first place.

A companion report, “The Environmental Impacts of U.S. Food Waste: Part 2,” will examine and compare the environmental impacts of a range of management pathways for food waste, such as landfilling, composting, and anaerobic digestion. EPA plans to complete and release this second report in Spring 2022. Together, these two reports will encompass the net environmental footprint of US food loss and waste.

Read the full report at https://www.epa.gov/system/files/documents/2021-11/from-farm-to-kitchen-the-environmental-impacts-of-u.s.-food-waste_508-tagged.pdf.  (PDF document, 113 pages)

For questions, contact Shannon Kenny, Senior Advisor, Food Loss and Food Waste, US EPA Office of Research and Development.

US national recycling goal announced, comments sought on National Recycling Strategy

America Recycles Day is celebrated on November 15 annually and serves as an opportunity to raise awareness of consumption, proper materials management options, and procedures, and to encourage Americans to commit to increasing and improving their recycling actions in the coming year.  It’s also an opportunity to highlight the importance of recycling not only for environmental integrity but also for the US economy. According to the US EPA, on a national average, there are 1.17 jobs, $65,230 wages, and $9,420 tax revenues attributable, for every 1,000 (US) tons of recyclables collected and recycled.

On November 16 and 17, 2020, EPA hosted its America Recycles Innovation Fair and Summit in a virtual format. This year’s events were of particular importance due to the announcement of a national recycling goal during the Summit. The goal is to increase the national recycling rate to 50% by the year 2030, or “50 by 30,” in its abbreviated form.

US EPA 50 by 30 logo

To provide some context, EPA regularly releases updated data on the management of Municipal Solid Waste (MSW), or the discarded materials generated, landfilled, or recycled from US residences. Because it takes a great deal of effort and coordination to gather and analyze all the data required for a national overview, reports typically reflect the reality of material flows from a few years prior. Last week, EPA released the 2018 Advancing Sustainable Materials Management: Facts and Figures report. The data reveal that “the recycling rate (including composting) was 32.1 percent in 2018, down from 34.7 percent in 2015.”

Increasing the recycling rate to 50% in the US would be a significant improvement. Seeing our national recycling rate increase, instead of continuing the disappointing downward trend, would be great news for those of us who care about sustainable materials management.

US EPA infographic detailing the environmental and economic impact of recycling and composting
US EPA Infographic

The reasons behind the underwhelming US recycling rate are many and complex, and we’ll only touch on some of the factors here. As is the case with so many environmental issues, there is a patchwork of policies and laws across the different states. With no federal policy or national or global coordination among impacted industries about labeling and product design to facilitate material reclamation at the end of a product’s life, there are a number of issues. These include confusion about what can be recycled, technical issues related to differing product structure, mixed messages, and inefficient implementation of programs.

Even within states, materials accepted in recycling programs often differ widely from one municipality or county to another. That’s because even materials that are technically recyclable (able to be recycled scientifically) may not be practically recyclable in a given location, due to lack of processing infrastructure, economic factors that make collection and processing of materials infeasible (e.g. availability of end markets, the volume of a material that can be collected in a given timeframe, etc.), and lack of clear, effective information for consumers to follow.

US EPA graph showing recycling and composting rates from 1960 to 2018
US EPA graph showing recycling and composting trends over time

There are also issues of “wishcycling”–when people want to believe an item is recyclable and put it into their bins without knowing if it’s accepted in their local program. This leads to contamination of batches of genuinely recyclable materials, potentially rendering them useless, as well as posing risks for recycling facility workers.

The way materials are collected can impact contamination levels and the quality or marketability of recycled feedstocks. Single-stream collection, for example, in which all materials accepted for recycling by a program are placed in the same collection bin, leads to higher contamination.  In the case of glass, this often leads to breakage and a reduced rate of reclamation alongside increased hazards.

International policies, such as the infamous “China ban” in which China stopped accepting imports of certain materials from countries like the US, have left recyclers and program coordinators with a domestic glut of materials for which there aren’t adequate end markets. In some cases that means materials separated by consumers for recycling have been sent to landfills. In the worst cases, recycling programs have ended due to budget constraints. All of this has lead to a lack of faith in recycling programs and options among US consumers, even where programs are available.

To address these various challenges, EPA has developed a draft National Recycling Strategy that identifies objectives and actions needed to create a stronger, more resilient U.S. recycling system. The draft strategy builds on The National Framework for Advancing the U.S. Recycling System, released in November 2019. That Framework was the result of collaborative efforts by stakeholders from across the recycling system launched during the first America Recycles Day Summit in 2018.

Today, recommended actions within the draft National Recycling Strategy are organized under three strategic objectives:

  • Reduce contamination in the recycling stream
  • Increase processing efficiency
  • Improve markets

The draft National Recycling Strategy is open for public comment until December 4, 2020. To leave a comment, go to https://www.regulations.gov/ and search for the docket EPA-HQ-OLEM-2020-0462. This is your opportunity to let EPA know your concerns, perceived challenges and barriers to progress, ideas to effectively increase our national recycling rate, and any suggestions for additions or improvement to the actions already outlined.

When you enter the docket number as listed above, you’ll see a “Memo Opening Docket for Public Comment” in the search results. Open that, and if you see “Open Docket Folder,” open that as well so you can view the primary document (Memo Opening Docket for Public Comment, with a “Comment Now” button next to it) plus two supporting documents–the actual text of the draft National Recycling Strategy and an executive summary of the text. (Note, if you’re redirected to a beta version of the new regulations.gov website, the process will be slightly different and you won’t have to open the docket folder to see the three relevant documents). You will also be able to view all previously submitted comments if you choose. Comments can be made anonymously.

To simplify the submission process,  you may want to prepare your comment in Microsoft Word, Google Docs, or similar program ahead of time, and copy and paste your thoughts into the online form. Note that if you want to refer to documents in your comment, you can upload supporting files via the comment form as well. For example, if your community has a particularly effective consumer education publication, you might want to provide it as an example or include a copy of a recycling policy, journal article, etc. For further guidance, consult the regulations.gov “Tips for Submitting Effective Comments” document, available in PDF format. Additional guidance on the comment submission process and contact information if you experience difficulty is available at https://www.regulations.gov/help.

Meanwhile, if you represent a US-based organization interested in working toward a more resilient materials economy, consider signing the America Recycles Pledge. This signifies your willingness to participate in ongoing dialogues and to take action with other pledge signers to improve America’s recycling system. Learn more at https://www.epa.gov/americarecycles/forms/america-recycles-pledge.

graphic version of the America Recycles Pledge

Additional Resources

Webinar: Pollution Prevention Opportunities for Ammonia Emissions in the Food and Beverage Sector

Register today for a free webinar from the US EPA, Wednesday, November 18, 2020, 1:00 PM – 2:00 PM CST.

The University of Wisconsin-Madison (UW-Madison) will cover their recently completed food and beverage pollution prevention (P2) work funded under EPA Region 5’s Pollution Prevention Grant Program. The webinar will provide attendees with:

  • an overview of the sources of emissions of ammonia from the industrial refrigeration systems commonly used in food and beverage processing facilities;
  • a summary of refrigerant inventory determination methods for industrial ammonia systems, including an Ammonia Inventory Calculator, which is a new online resource to estimate the operating charge of existing systems; and
  • the use of dynamic charge calculations for flagging refrigerant losses from systems that would otherwise go undetected.

Applications of these methods, along with best practices for identifying and eliminating fugitive ammonia leaks identified during fieldwork in Wisconsin food and beverage plants will also be discussed.

Speakers:

  • Douglas Reindl, Ph.D., P.E., Professor UW-Madison & Director of the Industrial Refrigeration Consortium
  • Marc Claas, Researcher, UW-Madison’s Industrial Refrigeration Consortium

University of Wisconsin-Madison logo

Industrial Refrigeration Consortium logo


Register online at https://register.gotowebinar.com/register/6143302827653408272.

Questions? Please contact Christine Anderson, US EPA Region 5.